Statistics
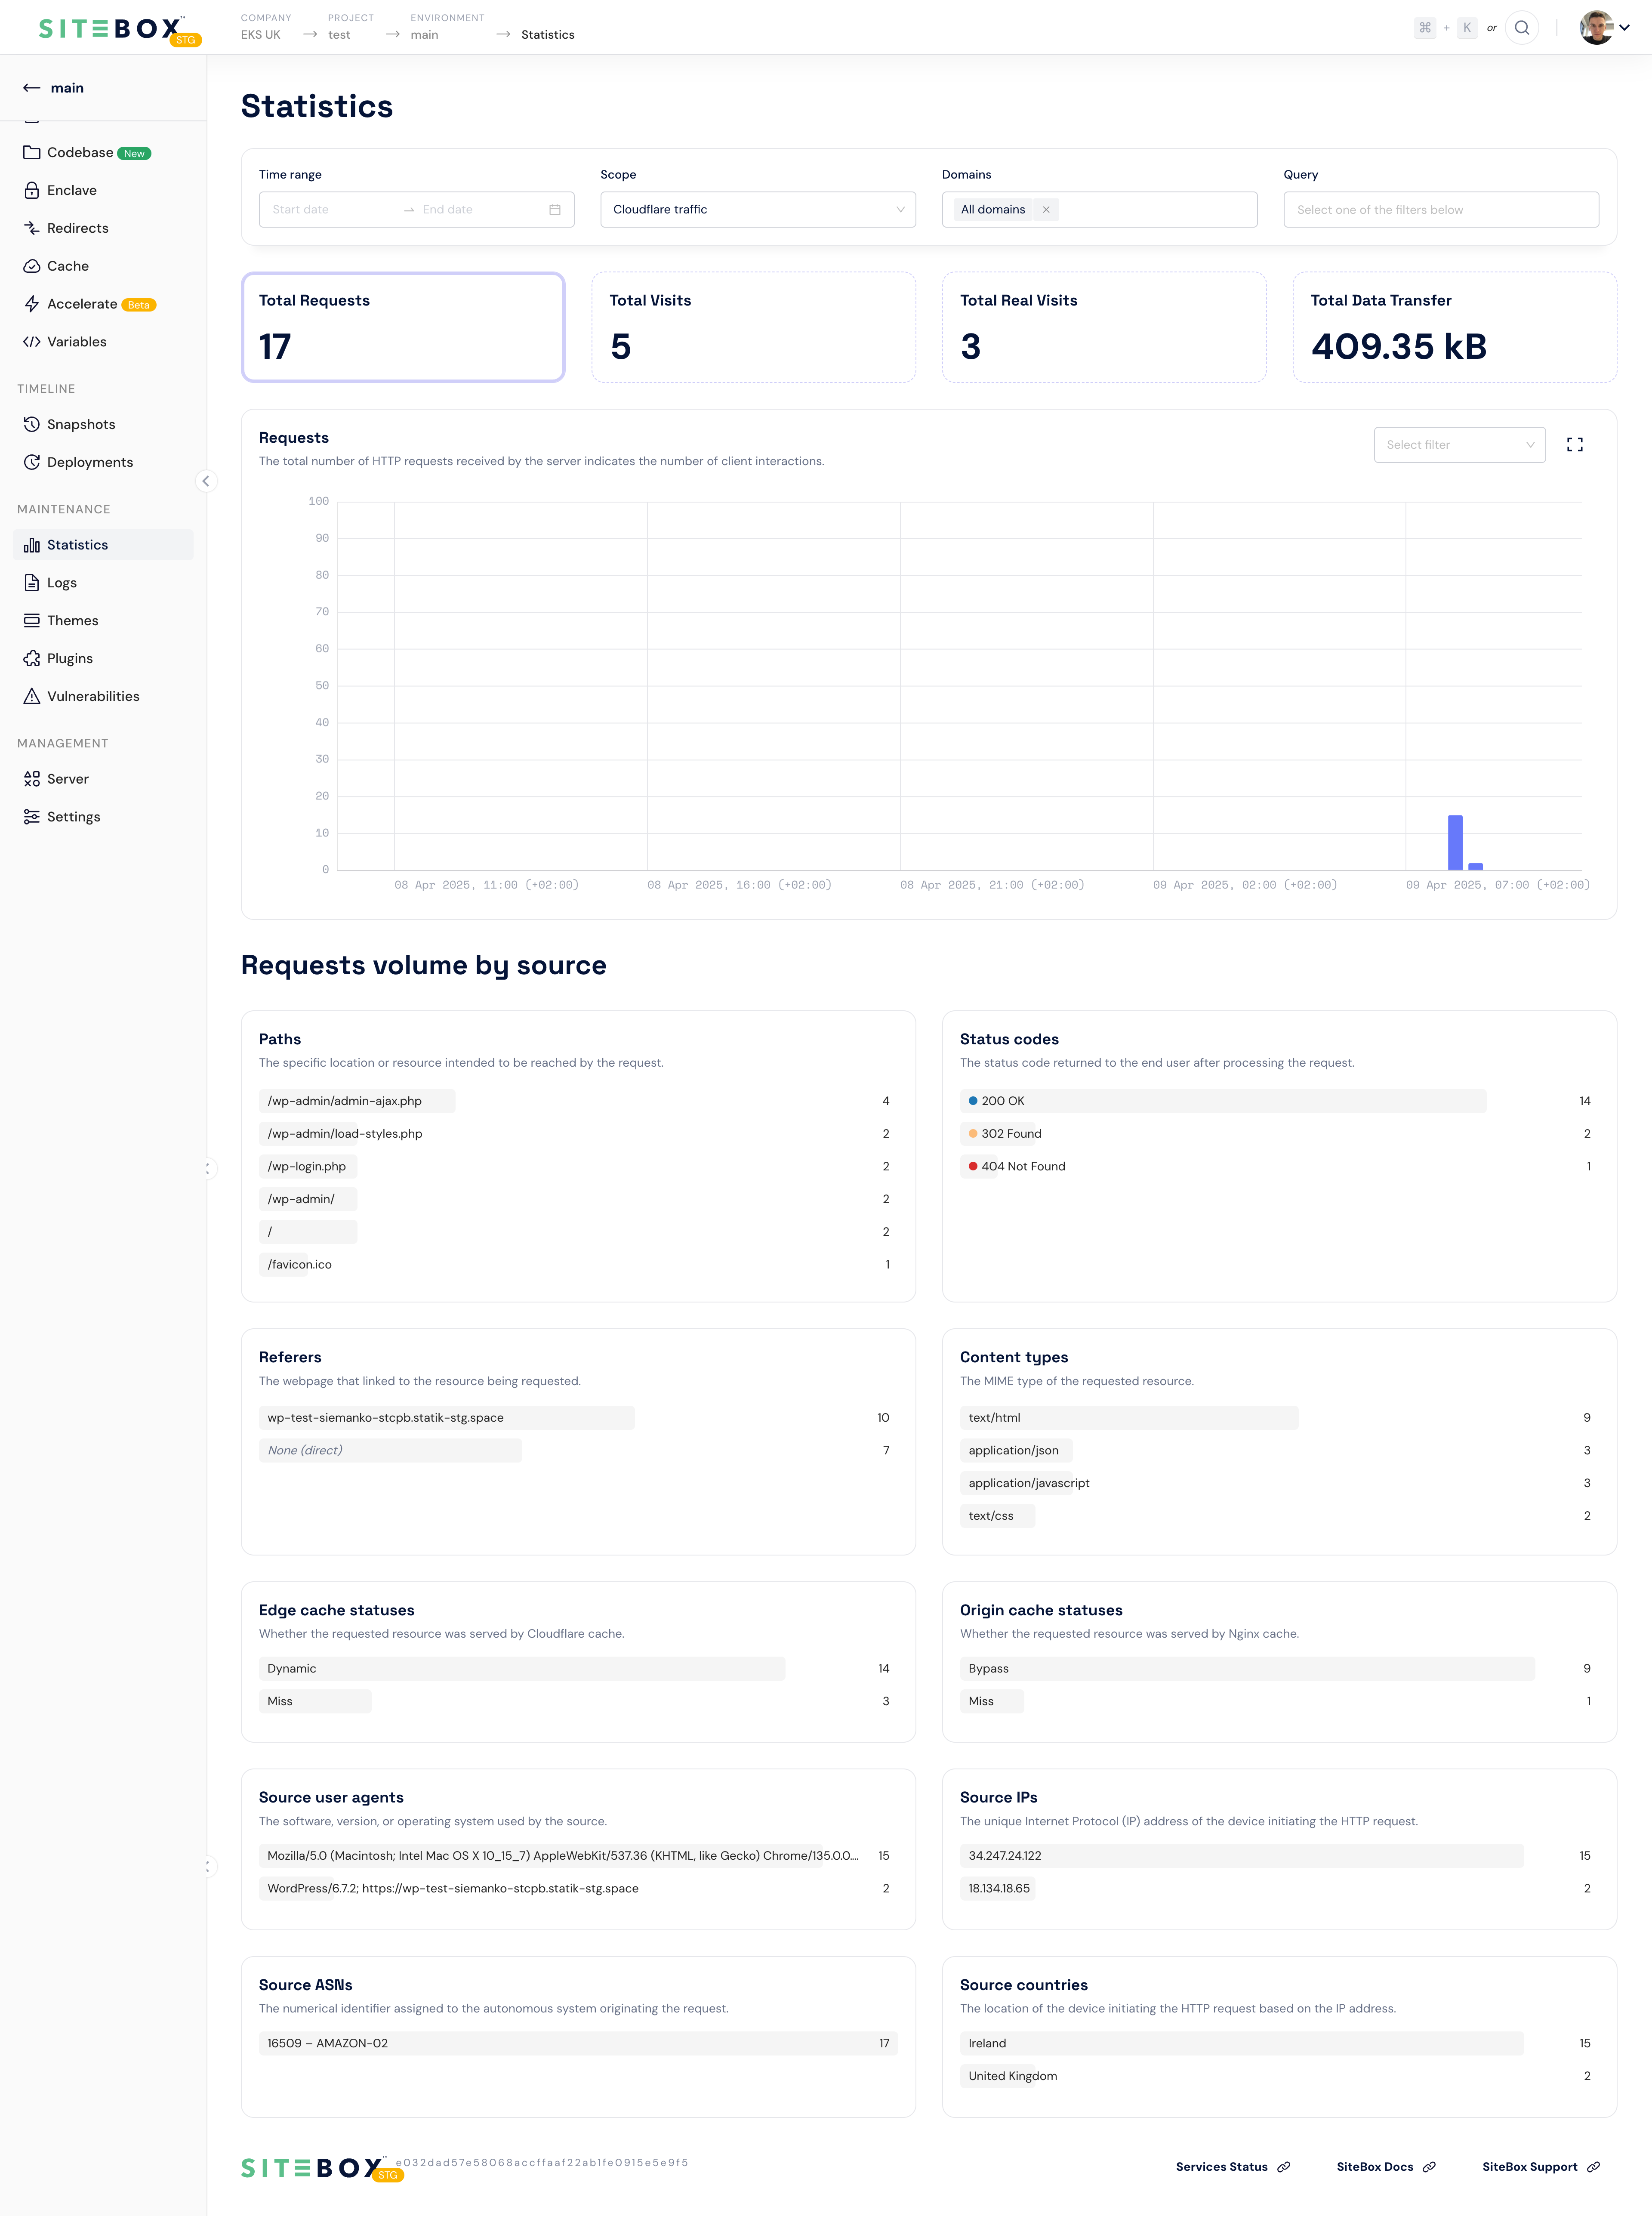
Usage metrics tailored to your requirementsSiteBox provides a set of statistics derived from the Origin and the Edge (Cloud) infrastructure, which serves as an excellent source of valuable information to analyze.

See also:
Origin infrastructure
Origin infrastructure that is focused on ensuring that your website always operates at the highest speed
See also:
Cloud infrastructure
Separation of origin from users using Cloud infrastructure to ensure maximum security
Filters
- Time range - by default, the displayed statistics cover the last hour, but you have the possibility to adjust the time range up to 30 days back.
- Domain - by default, statistics cover all domains assigned to the environment; however, there is an option to filter results by a specific domain,
- Query - you can narrow down the results by selecting a value from the available statistics,
Metrics
Graphical visualization of the following metrics in Origin infrastructure includes:
- Requests - total number of server requests,
- Visits - total unique visitors,
- Real Visits - total unique visitors that have been tracked by the SiteBox tracking system,
- Data transfer - network usage, illustrating data transfer across the network,
- Paths - pages visited within the environment,
- Status codes - response status indicators,
- Referers - referring pages that people are visiting from,
- Edge cache statuses - statuses indicating caching results from Edge,
- Origin cache statuses - statuses indicating caching results from Origin,
- Source user agents - information about user devices or applications,
- Source IPs - IP addresses associated with users,
- Source ASNs - autonomous system numbers connected to users,
- Source countries - geographical origins of traffic,
- Content types - types of content being requested,
- vCPU - a virtual CPU processor load, allowing tracking of processor performance,
- Memory - memory usage, revealing operational memory utilization levels.
vCPU and Memory statistics charts are only available in backend environments.
Statistics for paths, status codes, referers, edge cache statuses, origin cache statuses, source user agents, source IPs, source ASNs, source countries display the top 5 most frequent results.